Tinark
Active member
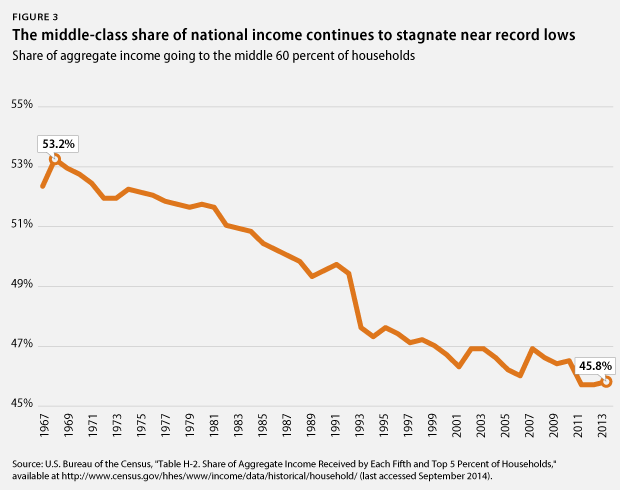
The general populist talking point on the left and the right is that the middle class has stagnated in the United States. Income is stagnant. Wages are stagnant. People are struggling. Life for the median or average person is not much improved today compared to the so called "golden era" of the middle class which peaked in the late 70's.
If so, how do you explain all of this? Improvement on almost every economic metric you can think of, as well as many non-economic ones, that has any value to life. If you can think of anything relevant that I have missed, please post it:
Square feet of living space per person:
1985 - Median living space per person/capita - ~650
2005 - Median living space per person/capita - ~750
http://www.huduser.org/publications/pdf/measuring_overcrowding_in_hsg.pdf
Life expectancy:
1980 - 73.66
2015 - 78.74
http://data.worldbank.org/indicator/SP.DYN.LE00.IN
Total percent of population with high school diploma, aged 25 or more:
1980 - 68.6%
2010 - 86.6%
Total percent of population with bachler's degree or higher, aged 25 or more
1980 -17.0%
2010 - 30.3%
http://www.census.gov/hhes/socdemo/education/data/cps/2010/tables.html
http://www.census.gov/hhes/socdemo/education/data/cps/1981/tab-12.pdf
Homicide victim rate:
1980 - 10.2 per 100,000
2013 - 4.5 per 100,000
Violent crime rate (excludes homicide):
1980 - 6.00 per 1,000
2013 - 3.68 per 1,000
Overall crime rates (violent, property, murder, rape, robbery, aggrevated assault, burgerly, larceny-theft, vehicle theft)
1980 - 5.95 per 100 population
2013 - 3.10 per 100 population
http://www.disastercenter.com/crime/uscrime.htm
Suicide rate
1980 - 13.2 per 100,000
2013 - 12.6 per 100,000
http://www.infoplease.com/ipa/A0779940.html
https://www.afsp.org/understanding-suicide/facts-and-figures
Vehicle ownership rates (per household):
1980-
No vehicles 12.9% One vehicle - 35.5% Two vehicles - 34.0% Three or more vehicles - 17.5%
Median = 1 vehicle
Vehicles per capita - .614
Vehicle miles per capita - 6,707
2010 - No vehicles 9.2% One vehicle 34.1% Two vehicles 37.3% Three or more vehicles 19.3%
Median = 2 vehicles
Vehicles per capita - .801
Vehicle miles per capita - 9,459
http://cta.ornl.gov/data/chapter8.shtml
Airline miles traveled
1980 - 190,776 million - 842 miles per capita
2013 - 589,692 million - 1,863 miles per capita
http://www.rita.dot.gov/bts/sites/r...ansportation_statistics/html/table_01_40.html
Motor vehicle deaths per 100 million miles traveled
1980 - 3.35
2013 - 1.11
https://en.wikipedia.org/wiki/List_of_motor_vehicle_deaths_in_U.S._by_year
Average hours worked per week - all employed persons
1980 - 35.0
2015 - 34.5
http://stats.oecd.org/index.aspx?DataSetCode=ANHRS
http://www.bls.gov/opub/mlr/2009/05/art1full.pdf


Much more eating out at restaurants

Equality for homosexuals - less bigotry against them
Less bigotry against basically every minority group, women, African
Americans, atheists, Mormons, and so on.
In summary (reasonable approximation) the typical/median/average person in the United States, from 1980 to today
Lives 5 years longer
Has 15% more living space
Is 33% more likely to own a vehicle
Is 26% more likely to have graduated from high school
Is 94% more likely to have a bachler's degree or higher
Is 60% less likely to be murdered annually
Is 39% less likely to be a victim of a violent crime annually
Is 48% less likely to be the victim of any crime annually
Travels 120% more miles by air
Works .5 hours less per week
Is 54% less likely to die in a residential fire
Is 70% less likely to die from a fatal workplace injury
Is 66% less likely to die in a vehicle accident per vehicle mile traveled
Suffers from 43% less workplace injuries and time-loss illness annually while employed
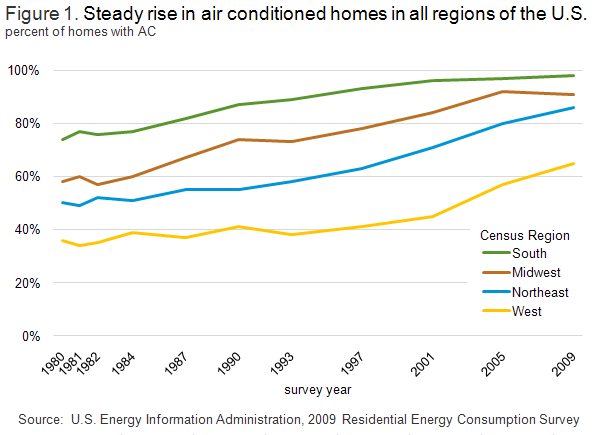
Has air conditioning, a computer, internet access, dishwasher, and cell phone today, whereas the typical person in 1980 was lacking all of these
Has much cleaner air with 68% less pollutants of the 6 most common air pollutants that can harm health
Dines out much more frequently
If a minority, suffers much less from bigotry, sexism, racism, homophobia, etc.
Stagnating middle class? REALLY?
If so, how do you explain all of this? Improvement on almost every economic metric you can think of, as well as many non-economic ones, that has any value to life. If you can think of anything relevant that I have missed, please post it:
Square feet of living space per person:
1985 - Median living space per person/capita - ~650
2005 - Median living space per person/capita - ~750
http://www.huduser.org/publications/pdf/measuring_overcrowding_in_hsg.pdf
Life expectancy:
1980 - 73.66
2015 - 78.74
http://data.worldbank.org/indicator/SP.DYN.LE00.IN
Total percent of population with high school diploma, aged 25 or more:
1980 - 68.6%
2010 - 86.6%
Total percent of population with bachler's degree or higher, aged 25 or more
1980 -17.0%
2010 - 30.3%
http://www.census.gov/hhes/socdemo/education/data/cps/2010/tables.html
http://www.census.gov/hhes/socdemo/education/data/cps/1981/tab-12.pdf
Homicide victim rate:
1980 - 10.2 per 100,000
2013 - 4.5 per 100,000
Violent crime rate (excludes homicide):
1980 - 6.00 per 1,000
2013 - 3.68 per 1,000
Overall crime rates (violent, property, murder, rape, robbery, aggrevated assault, burgerly, larceny-theft, vehicle theft)
1980 - 5.95 per 100 population
2013 - 3.10 per 100 population
http://www.disastercenter.com/crime/uscrime.htm
Suicide rate
1980 - 13.2 per 100,000
2013 - 12.6 per 100,000
http://www.infoplease.com/ipa/A0779940.html
https://www.afsp.org/understanding-suicide/facts-and-figures
Vehicle ownership rates (per household):
1980-
No vehicles 12.9% One vehicle - 35.5% Two vehicles - 34.0% Three or more vehicles - 17.5%
Median = 1 vehicle
Vehicles per capita - .614
Vehicle miles per capita - 6,707
2010 - No vehicles 9.2% One vehicle 34.1% Two vehicles 37.3% Three or more vehicles 19.3%
Median = 2 vehicles
Vehicles per capita - .801
Vehicle miles per capita - 9,459
http://cta.ornl.gov/data/chapter8.shtml
Airline miles traveled
1980 - 190,776 million - 842 miles per capita
2013 - 589,692 million - 1,863 miles per capita
http://www.rita.dot.gov/bts/sites/r...ansportation_statistics/html/table_01_40.html
Motor vehicle deaths per 100 million miles traveled
1980 - 3.35
2013 - 1.11
https://en.wikipedia.org/wiki/List_of_motor_vehicle_deaths_in_U.S._by_year
Average hours worked per week - all employed persons
1980 - 35.0
2015 - 34.5
http://stats.oecd.org/index.aspx?DataSetCode=ANHRS
http://www.bls.gov/opub/mlr/2009/05/art1full.pdf
Much more eating out at restaurants
Equality for homosexuals - less bigotry against them
Less bigotry against basically every minority group, women, African
Americans, atheists, Mormons, and so on.
In summary (reasonable approximation) the typical/median/average person in the United States, from 1980 to today
Lives 5 years longer
Has 15% more living space
Is 33% more likely to own a vehicle
Is 26% more likely to have graduated from high school
Is 94% more likely to have a bachler's degree or higher
Is 60% less likely to be murdered annually
Is 39% less likely to be a victim of a violent crime annually
Is 48% less likely to be the victim of any crime annually
Travels 120% more miles by air
Works .5 hours less per week
Is 54% less likely to die in a residential fire
Is 70% less likely to die from a fatal workplace injury
Is 66% less likely to die in a vehicle accident per vehicle mile traveled
Suffers from 43% less workplace injuries and time-loss illness annually while employed
Has air conditioning, a computer, internet access, dishwasher, and cell phone today, whereas the typical person in 1980 was lacking all of these
Has much cleaner air with 68% less pollutants of the 6 most common air pollutants that can harm health
Dines out much more frequently
If a minority, suffers much less from bigotry, sexism, racism, homophobia, etc.
Stagnating middle class? REALLY?